Squared deviations from the mean
Calculations in probability theory
Squared deviations from the mean (SDM) result from squaring deviations. In probability theory and statistics, the definition of variance is either the expected value of the SDM (when considering a theoretical distribution) or its average value (for actual experimental data). Computations for analysis of variance involve the partitioning of a sum of SDM.
01Background
An understanding of the computations involved is greatly enhanced by a study of the statistical value
, where
is the expected value operator.
For a random variable 



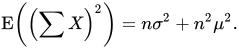
(Its derivation is shown here.) Therefore,

From the above, the following can be derived:

02Sample variance
The sum of squared deviations needed to calculate sample variance (before deciding whether to divide by n or n − 1) is most easily calculated as

From the two derived expectations above the expected value of this sum is


This effectively proves the use of the divisor n − 1 in the calculation of an unbiased sample estimate of σ2.
03Partition, analysis of variance
In the situation where data is available for k different treatment groups having size ni where i varies from 1 to k, then it is assumed that the expected mean of each group is

and the variance of each treatment group is unchanged from the population variance
Under the Null Hypothesis that the treatments have no effect, then each of the 
It is now possible to calculate three sums of squares:
- Individual


- Treatments
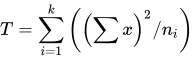
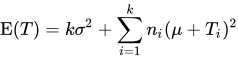

Under the null hypothesis that the treatments cause no differences and all the

- Combination
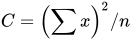

Sums of squared deviations
Under the null hypothesis, the difference of any pair of I, T, and C does not contain any dependency on
total squared deviations aka total sum of squares
treatment squared deviations aka explained sum of squares
residual squared deviations aka residual sum of squares
The constants (n − 1), (k − 1), and (n − k) are normally referred to as the number of degrees of freedom.
Example
In a very simple example, 5 observations arise from two treatments. The first treatment gives three values 1, 2, and 3, and the second treatment gives two values 4, and 6.



Giving
- Total squared deviations = 66 − 51.2 = 14.8 with 4 degrees of freedom.
- Treatment squared deviations = 62 − 51.2 = 10.8 with 1 degree of freedom.
- Residual squared deviations = 66 − 62 = 4 with 3 degrees of freedom.
Two-way analysis of variance
In statistics, the two-way analysis of variance (ANOVA) is used to study how two categorical independent variables affect one continuous dependent variable. It extends the One-way analysis of variance (one-way ANOVA) by allowing both factors to be analyzed at the same time. A two-way ANOVA evaluates the main effect of each independent variable and if there is any interaction between them.
Researchers use this test to see if two factors act independent or combined to influence a Dependent variable. It is used in the fields of Psychology, Agriculture, Education, and Biomedical research. For example, it can be used to study how fertilizer type and water level together affect plant growth. The analysis produces F-statistics that indicate whether observed differences between groups are statistically significant.
Sources and credits
This article is adapted from the Wikipedia article “Squared deviations from the mean”, written by its contributors and licensed under CC BY-SA 4.0. Fathomly has changed the layout, removed citation markers, navigation and maintenance notices, and adjusted punctuation. This adapted version is shared under the same license. For references, see the original article.
Fathomly is not affiliated with or endorsed by the Wikimedia Foundation. Spotted a problem? Tell us.
