Symmetric mean absolute percentage error
Statistical accuracy measure
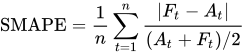
The symmetric mean absolute percentage error (SMAPE or sMAPE) is an accuracy measure based on percentage (or relative) errors. It is usually defined as follows:

where 


Explaining this equation in words, the absolute difference between At and Ft is divided by half the sum of absolute values of the actual value At and the forecast value Ft. The value of this calculation is summed for every fitted point t and divided again by the number of fitted points n.
01History
The earliest reference to a similar formula appears to be Armstrong (1985, p. 348), where it is called "adjusted MAPE" and is defined without the absolute values in the denominator. It was later discussed, modified, and re-proposed by Flores (1986).
Armstrong's original definition is as follows:
The problem is that it can be negative if 
02Discussion
Comparison with MAPE
The idea behind SMAPE is that over and under-forecasts are treated in a relative way, rather than an absolute way, as with the mean absolute percentage error (MAPE). For example, applying the formula above to some actual 

| | MAPE | SMAPE |
|---|---|---|---|
| 100 | 110 | 10% | 9.52% |
| 100 | 90 | 10% | 10.53% |
we see that MAPE considers an over and underestimation of 10% as equivalent, whereas SMAPE considers the underestimation to be slightly "worse" than the overestimation.
Extending this to larger forecast errors:
| | MAPE | SMAPE |
|---|---|---|---|
| 100 | 200 | 100% | 66.67% |
| 100 | 50 | 50% | 66.67% |
Here, double overestimation and half underestimation are treated equivalently by SMAPE, whereas MAPE considers the overestimation to be "twice as bad" as the underestimation.
Extending to an even more extreme case:
| | MAPE | SMAPE |
|---|---|---|---|
| 100 | 1,000 | 900% | 163.63% |
| 100 | 10 | 90% | 163.63% |
Here it becomes clear that MAPE is unbounded from above, and can provide extremely large penalties for overestimations, but cannot do the same for extreme underestimations. SMAPE, on the other hand, is bounded between 0% and 200%, and penalises these larger over and underestimations in a more "symmetric" manner.
Therefore, the choice between MAPE and SMAPE depends entirely on the problem at hand, and whether or not a relative metric is more appropriate. This may be the case if the expected forecasting errors exceed 
Alternative Versions
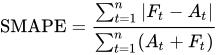
As a "percentage error", SMAPE values between 0% and 100% can be considered easier to interpret, and an alternative formula is sometimes used in practice:

There is also a third version of SMAPE, which allows measuring the direction of the bias in the data by generating a positive and a negative error on line item level. Furthermore, it is better protected against outliers and the bias effect. The formula is:
03Alternatives
Provided the data are strictly positive, an alternative measure of relative accuracy can be obtained based on the log of the accuracy ratio: log(Ft / At). This measure is easier to analyze statistically and has valuable symmetry and unbiasedness properties. When used in constructing forecasting models, the resulting prediction corresponds to the geometric mean (Tofallis, 2015) , whereas ordinary least squares models predict the arithmetic mean. The geometric mean is less affected by outliers than the arithmetic mean.
Sources and credits
This article is adapted from the Wikipedia article “Symmetric mean absolute percentage error”, written by its contributors and licensed under CC BY-SA 4.0. Fathomly has changed the layout, removed citation markers, navigation and maintenance notices, and adjusted punctuation. This adapted version is shared under the same license. For references, see the original article.
Fathomly is not affiliated with or endorsed by the Wikimedia Foundation. Spotted a problem? Tell us.
