Reference articles on history, science, culture and more
Encyclopedia

Relative permeability

Dimensionless measure of a porous material's permeability

In multiphase flow in porous media, the relative permeability of a phase is a dimensionless measure of the effective permeability of that phase. It is the ratio of the effective permeability of that phase to the absolute permeability. It can be viewed as an adaptation of Darcy's law to multiphase flow.

01Formulation

For two-phase flow in porous media given steady-state conditions, we can write

q_{i}=-{\frac {k_{i}}{\mu _{i}}}\nabla P_{i}\qquad {\text{for}}\quad i=1,2

where q_{i} is the flux, \nabla P_{i} is the pressure drop, \mu _{i} is the viscosity. The subscript i indicates that the parameters are for phase i.

k_{i} is here the phase permeability (i.e., the effective permeability of phase i), as observed through the equation above.

Relative permeability, k_{\mathit {ri}}, for phase i is then defined from k_{i}=k_{\mathit {ri}}k, as

k_{\mathit {ri}}=k_{i}/k

where k is the permeability of the porous medium in single-phase flow, i.e., the absolute permeability. Relative permeability must be between zero and one.

In applications, relative permeability is often represented as a function of water saturation; however, owing to capillary hysteresis one often resorts to a function or curve measured under drainage and another measured under imbibition.

Under this approach, the flow of each phase is inhibited by the presence of the other phases. Thus the sum of relative permeabilities over all phases is less than 1. However, apparent relative permeabilities larger than 1 have been obtained since the Darcean approach disregards the viscous coupling effects derived from momentum transfer between the phases (see assumptions below). This coupling could enhance the flow instead of inhibit it. This has been observed in heavy oil petroleum reservoirs when the gas phase flows as bubbles or patches (disconnected).

Normalization of water saturation values

02Modelling assumptions

The above form for Darcy's law is sometimes also called Darcy's extended law, formulated for horizontal, one-dimensional, immiscible multiphase flow in homogeneous and isotropic porous media. The interactions between the fluids are neglected, so this model assumes that the solid porous media and the other fluids form a new porous matrix through which a phase can flow, implying that the fluid-fluid interfaces remain static in steady-state flow, which is not true, but this approximation has proven useful anyway.

Each of the phase saturations must be larger than the irreducible saturation, and each phase is assumed continuous within the porous medium.

Based on data from special core analysis laboratory (SCAL) experiments, simplified models of relative permeability as a function of saturation (e.g. water saturation) can be constructed. This article will focus on an oil-water system.

03Saturation scaling

The water saturation S_{\mathit {w}} is the fraction of the pore volume that is filled with water, and similarly for the oil saturation S_{\mathit {o}}. Thus, saturations are themselves scaled properties or variables. This gives the constraint

S_{\mathit {w}}+S_{\mathit {o}}=1\Leftrightarrow S_{\mathit {w}}=1-S_{\mathit {o}}

The model functions or correlations for relative permeabilities in an oil-water system are therefore usually written as functions of only water saturation, and this makes it natural to select water saturation as the horizontal axis in graphical presentations. Let S_{\mathit {wir}} (also denoted S_{\mathit {wc}} and sometimes S_{\mathit {wr}}) be the irreducible (or minimal or connate) water saturation, and let S_{\mathit {orw}} be the residual (minimal) oil saturation after water flooding (imbibition). The flowing water saturation window in a water invasion / injection / imbibition process is bounded by a minimum value S_{\mathit {wir}} and a maximum value S_{\mathit {wor}}=1-S_{\mathit {orw}}. In mathematical terms the flowing saturation window is written as

S_{\mathit {wir}}\leq S_{\mathit {w}}\leq S_{\mathit {wor}}=1-S_{\mathit {orw}}

By scaling the water saturation to the flowing saturation window, we get a (new or another) normalized water saturation value

S_{\mathit {wn}}=S_{\mathit {wn}}(S_{w})={\frac {S_{w}-S_{\mathit {wir}}}{1-S_{\mathit {wir}}-S_{\mathit {orw}}}}={\frac {S_{w}-S_{\mathit {wir}}}{S_{\mathit {wor}}-S_{\mathit {wir}}}}

and a normalized oil saturation value

S_{\mathit {on}}=1-S_{\mathit {wn}}={\frac {S_{o}-S_{\mathit {orw}}}{1-S_{\mathit {wir}}-S_{\mathit {orw}}}}
Example of Corey-correlation for imbibition flow with = and .

04Endpoints

Let K_{\mathit {row}} be oil relative permeability, and let K_{\mathit {rw}} be water relative permeability. There are two ways of scaling phase permeability (i.e. effective permeability of the phase). If we scale phase permeability w.r.t. absolute water permeability (i.e. S_{\mathit {w}}=1), we get an endpoint parameter for both oil and water relative permeability. If we scale phase permeability w.r.t. oil permeability with irreducible water saturation present, K_{\mathit {row}} endpoint is one, and we are left with only the K_{\mathit {rw}} endpoint parameter. In order to satisfy both options in the mathematical model, it is common to use two endpoint symbols in the model for two-phase relative permeability. The endpoints / endpoint parameters of oil and water relative permeabilities are

{\begin{aligned}K_{\mathit {row}}(S_{\mathit {wir}})=K_{\mathit {rot}}&&{\text{and}}&&K_{\mathit {rw}}(S_{\mathit {wor}})=K_{\mathit {rwr}}\end{aligned}}

These symbols have their merits and limits. The symbol K_{\mathit {rot}} emphasize that it represents the top point of K_{\mathit {row}}. It occurs at irreducible water saturation, and it is the largest value of K_{\mathit {row}} that can occur for initial water saturation. The competing endpoint symbol K_{\mathit {ror}} occurs in imbibition flow in oil-gas systems. If the permeability basis is oil with irreducible water present, then K_{\mathit {rot}}=1. The symbol K_{\mathit {rwr}} emphasizes that it is occurring at the residual oil saturation. An alternative symbol to K_{\mathit {rwr}} is K_{\mathit {rw}}^{o} which emphasizes that the reference permeability is oil permeability with irreducible water S_{\mathit {wir}} present.

The oil and water relative permeability models are then written as

{\begin{aligned}K_{\mathit {row}}=K_{\mathit {rot}}\cdot K_{\mathit {rown}}(S_{\mathit {wn}})&&{\text{and}}&&K_{\mathit {rw}}=K_{\mathit {rwr}}\cdot K_{\mathit {rwn}}(S_{\mathit {wn}})\end{aligned}}

The functions K_{\mathit {rown}} and K_{\mathit {rwn}} are called normalised relative permeabilities or shape functions for oil and water, respectively. The endpoint parameters K_{\mathit {rot}} and K_{\mathit {rwr}} (which is a simplification of K_{\mathit {rwor}}) are physical properties that are obtained either before or together with the optimization of shape parameters present in the shape functions.

There are often many symbols in articles that discuss relative permeability models and modelling. A number of busy core analysts, reservoir engineers and scientists often skip using tedious and time-consuming subscripts, and write e.g. Krow instead of K_{\mathit {row}} or k_{\mathit {row}} or krow or oil relative permeability. A variety of symbols are therefore to be expected, and accepted as long as they are explained or defined.

The effects that slip or no-slip boundary conditions in pore flow have on endpoint parameters, are discussed by Berg et alios.

05Corey-model

An often used approximation of relative permeability is the Corey correlation which is a power law in saturation. The Corey correlations of the relative permeability for oil and water are then


K_{\mathit {row}}(S_{w})=K{_{\mathit {rot}}}(1-S_{\mathit {wn}})^{N_{\mathit {o}}}
K_{\mathit {rw}}(S_{w})=K{_{\mathit {rwr}}}S_{\mathit {wn}}^{N_{\mathit {w}}}

If the permeability basis is normal oil with irreducible water present, then K_{\mathit {rot}}=1.

The empirical parameters N_{\mathit {o}} and N_{\mathit {w}} are called curve shape parameters or simply shape parameters, and they can be obtained from measured data either by analytical interpretation of measured data, or by optimization using a core flow numerical simulator to match the experiment (often called history matching). N_{\mathit {o}}=N_{\mathit {w}}=2 is sometimes appropriate. The physical properties K_{\mathit {rot}} and K_{\mathit {rwr}} are obtained either before or together with the optimizing of N_{\mathit {o}} and N_{\mathit {w}}.

In case of gas-water system or gas-oil system there are Corey correlations similar to the oil-water relative permeabilities correlations shown above.

Example of LET-correlation for imbibition flow with L,E,T all equal to 2 and .

06LET-model

The Corey-correlation or Corey model has only one degree of freedom for the shape of each relative permeability curve, the shape parameter N. The LET-correlation adds more degrees of freedom in order to accommodate the shape of relative permeability curves in SCAL experiments and in 3D reservoir models that are adjusted to match historic production. These adjustments frequently includes relative permeability curves and endpoints.

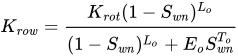
The LET-type approximation is described by 3 parameters L, E, T. The correlation for water and oil relative permeability with water injection is thus
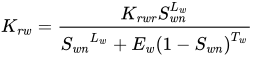
K_{\mathit {rw}}={\frac {{K_{\mathit {rwr}}}S_{\mathit {wn}}^{L_{\mathit {w}}}}{{S_{\mathit {wn}}}^{L_{\mathit {w}}}+{E_{\mathit {w}}}{(1-S_{\mathit {wn}})}^{T_{\mathit {w}}}}}

and

K_{\mathit {row}}={\frac {K_{\mathit {rot}}(1-S_{\mathit {wn}})^{L_{o}}}{{(1-S_{\mathit {wn}})^{L_{o}}}+{E_{\mathit {o}}}S_{\mathit {wn}}^{T_{\mathit {o}}}}}

written using the same S_{w} normalization as for Corey.

Only S_{\mathit {wir}}, S_{\mathit {orw}}, K_{\mathit {rot}}, and K_{\mathit {rwr}} have direct physical meaning, while the parameters L, E and T are empirical. The parameter L describes the lower part of the curve, and by similarity and experience the L-values are comparable to the appropriate Corey parameter. The parameter T describes the upper part (or the top part) of the curve in a similar way that the L-parameter describes the lower part of the curve. The parameter E describes the position of the slope (or the elevation) of the curve. A value of one is a neutral value, and the position of the slope is governed by the L- and T-parameters. Increasing the value of the E-parameter pushes the slope towards the high end of the curve. Decreasing the value of the E-parameter pushes the slope towards the lower end of the curve. Experience using the LET correlation indicates the following reasonable ranges for the parameters L, E, and T: L ≥ 0.1, E > 0 and T ≥ 0.1.

In case of gas-water system or gas-oil system there are LET correlations similar to the oil-water relative permeabilities correlations shown above.

07Evaluations

After Morris Muskat et alios established the concept of relative permeability in late 1930'ies, the number of correlations, i.e. models, for relative permeability has steadily increased. This creates a need for evaluation of the most common correlations at the current time. Two of the latest (per 2019) and most thorough evaluations are done by Moghadasi et alios and by Sakhaei et alios. Moghadasi et alios evaluated Corey, Chierici and LET correlations for oil/water relative permeability using a sophisticated method that takes into account the number of uncertain model parameters. They found that LET, with the largest number (three) of uncertain parameters, was clearly the best one for both oil and water relative permeability. Sakhaei et alios evaluated 10 common and widely used relative permeability correlations for gas/oil and gas/condensate systems, and found that LET showed best agreement with experimental values for both gas and oil/condensate relative permeability.

Watch videos about Relative permeabilityExplainers and documentaries on YouTube (opens in a new tab)

Sources and credits

This article is adapted from the Wikipedia article Relative permeability, written by its contributors and licensed under CC BY-SA 4.0. Fathomly has changed the layout, removed citation markers, navigation and maintenance notices, and adjusted punctuation. This adapted version is shared under the same license. For references, see the original article.

Images, from Wikimedia Commons:

Fathomly is not affiliated with or endorsed by the Wikimedia Foundation. Spotted a problem? Tell us.