Process capability index
Statistical measure of process capability
The process capability index, or process capability ratio, is a statistical measure of process capability: the ability of an engineering process to produce an output within specification limits. The concept of process capability only holds meaning for processes that are in a state of statistical control. This means it cannot account for deviations which are not expected, such as misaligned, damaged, or worn equipment. Process capability indices measure how much "natural variation" a process experiences relative to its specification limits, and allows different processes to be compared to how well an organization controls them. Somewhat counterintuitively, higher index values indicate better performance, with zero indicating high deviation.
01Example for non-specialists
A company produces axles with nominal diameter 20 mm on a lathe. As no axle can be made to exactly 20.000000 mm, the designer specifies the maximum admissible deviations (called tolerances or specification limits). For instance, the requirement could be that axles need to be between 19.9 and 20.2 mm. The process capability index is a measure for how likely it is that a produced axle satisfies this requirement. The index pertains to statistical (natural) variations only. These are variations that naturally occur without a specific cause. Errors not addressed include operator errors, or play in the lathe's mechanisms resulting in a wrong or unpredictable tool position. If errors of the latter kinds occur, the process is not in a state of statistical control. When this is the case, the process capability index is meaningless.
02Introduction
If the upper and lower specification limits of the process are USL and LSL, the target process mean is T, the estimated mean of the process is 

| Index | Description |
|---|---|
 |
Estimates what the process is capable of producing if the process mean were to be centered between the specification limits. Assumes process output is approximately normally distributed. |
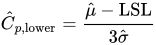 |
Estimates process capability for specifications that consist of a lower limit only (for example, strength). Assumes process output is approximately normally distributed. |
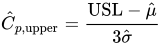 |
Estimates process capability for specifications that consist of an upper limit only (for example, concentration). Assumes process output is approximately normally distributed. |
![{\hat {C}}_{pk}=\min {\Bigg [}{{\text{USL}}-{\hat {\mu }} \over 3{\hat {\sigma }}},{{\hat {\mu }}-{\text{LSL}} \over 3{\hat {\sigma }}}{\Bigg ]}](https://wikimedia.org/api/rest_v1/media/math/render/svg/ca677d2001052bf0545a61bde6b3fd5d269dedb8) |
Estimates what the process is capable of producing, considering that the process mean may not be centered between the specification limits. (If the process mean is not centered,  overestimates process capability.) overestimates process capability.)  if the process mean falls outside of the specification limits. Assumes process output is approximately normally distributed. if the process mean falls outside of the specification limits. Assumes process output is approximately normally distributed. |
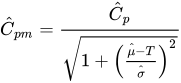 |
Estimates process capability around a target, T.  is always greater than zero. Assumes process output is approximately normally distributed. is also known as the Taguchi capability index. is always greater than zero. Assumes process output is approximately normally distributed. is also known as the Taguchi capability index. |
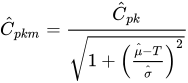 |
Estimates process capability around a target, T, and accounts for an off-center process mean. Assumes process output is approximately normally distributed. |
03Recommended values
Process capability indices are constructed to express more desirable capability with increasingly higher values. Values near or below zero indicate processes operating off target (
Fixing values for minimum "acceptable" process capability targets is a matter of personal opinion, and what consensus exists varies by industry, facility, and the process under consideration. For example, in the automotive industry, the Automotive Industry Action Group sets forth guidelines in the Production Part Approval Process, 4th edition for recommended Cpk minimum values for critical-to-quality process characteristics. However, these criteria are debatable and several processes may not be evaluated for capability just because they have not properly been assessed.
Since the process capability is a function of the specification, the Process Capability Index is only as good as the specification. For instance, if the specification came from an engineering guideline without considering the function and criticality of the part, a discussion around process capability is useless, and would have more benefits if focused on what are the real risks of having a part borderline out of specification. The loss function of Taguchi better illustrates this concept.
At least one academic expert recommends the following:
| Situation | Recommended minimum process capability for two-sided specifications | Recommended minimum process capability for one-sided specification |
|---|---|---|
| Existing process | 1.33 | 1.25 |
| New process | 1.50 | 1.45 |
| Safety or critical parameter for existing process | 1.50 | 1.45 |
| Safety or critical parameter for new process | 1.67 | 1.60 |
| Six Sigma quality process | 2.00 | 2.00 |
However where a process produces a characteristic with a capability index greater than 2.5, the unnecessary precision may be expensive.
04Relationship to measures of process fallout
The mapping from process capability indices, such as Cpk, to measures of process fallout is straightforward. Process fallout quantifies how many defects a process produces and is measured by DPMO or PPM. Process yield is the complement of process fallout and is approximately equal to the area under the probability density function 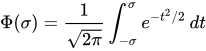
In the short term ("short sigma"), the relationships are:
| Cp | Sigma level (σ) | Area under the | Process yield | Process fallout
(in terms of DPMO/PPM) |
|---|---|---|---|---|
| 0.33 | 1 | 0.6826894921 | 68.27% | 317311 |
| 0.67 | 2 | 0.9544997361 | 95.45% | 45500 |
| 1.00 | 3 | 0.9973002039 | 99.73% | 2700 |
| 1.33 | 4 | 0.9999366575 | 99.99% | 63 |
| 1.67 | 5 | 0.9999994267 | 99.9999% | 1 |
| 2.00 | 6 | 0.9999999980 | 99.9999998% | 0.002 |

In the long term, processes can shift or drift significantly (most control charts are only sensitive to changes of 1.5σ or greater in process output). If there was a 1.5 sigma shift 1.5σ off of target in the processes (see Six Sigma), it would then produce these relationships:
| Cp | Adjusted
Sigma level (σ) |
Area under the | Process yield | Process fallout
(in terms of DPMO/PPM) |
|---|---|---|---|---|
| 0.33 | 1 | 0.3085375387 | 30.85% | 691462 |
| 0.67 | 2 | 0.6914624613 | 69.15% | 308538 |
| 1.00 | 3 | 0.9331927987 | 93.32% | 66807 |
| 1.33 | 4 | 0.9937903347 | 99.38% | 6209 |
| 1.67 | 5 | 0.9997673709 | 99.9767% | 232.6 |
| 2.00 | 6 | 0.9999966023 | 99.99966% | 3.40 |
Because processes can shift or drift significantly long term, each process would have a unique sigma shift value, thus process capability indices are less applicable as they require statistical control.
05Example
Consider a quality characteristic with target of 100.00 μm and upper and lower specification limits of 106.00 μm and 94.00 μm respectively. If, after carefully monitoring the process for a while, it appears that the process is in control and producing output predictably (as depicted in the run chart below), we can meaningfully estimate its mean and standard deviation.
If
| Index |
|---|
 |
![{\hat {C}}_{pk}=\min {\Bigg [}{{\text{USL}}-{\hat {\mu }} \over 3{\hat {\sigma }}},{{\hat {\mu }}-{\text{LSL}} \over 3{\hat {\sigma }}}{\Bigg ]}=\min {\Bigg [}{106.00-98.94 \over 3\times 1.03},{98.94-94 \over 3\times 1.03}{\Bigg ]}=1.60](https://wikimedia.org/api/rest_v1/media/math/render/svg/92a1d39f30f9d41b5b0943cb55654b788b191324) |
 |
 |
The fact that the process is running off-center (about 1σ below its target) is reflected in the markedly different values for Cp, Cpk, Cpm, and Cpkm.
Sources and credits
This article is adapted from the Wikipedia article “Process capability index”, written by its contributors and licensed under CC BY-SA 4.0. Fathomly has changed the layout, removed citation markers, navigation and maintenance notices, and adjusted punctuation. This adapted version is shared under the same license. For references, see the original article.
Fathomly is not affiliated with or endorsed by the Wikimedia Foundation. Spotted a problem? Tell us.