Process flow diagram
Diagram used in process engineering
A process flow diagram (PFD) is a diagram commonly used in chemical and process engineering to indicate the general flow of plant processes and equipment. The PFD displays the relationship between major equipment of a plant facility and does not show minor details such as piping details and designations. Another commonly used term for a PFD is process flowsheet. It is the key document in process design.
01Typical content of a process flow diagram
Typically, process flow diagrams of a single unit process include the following:
- Process piping
- Major equipment items
- Connections with other systems
- Major bypass and recirculation (recycle) streams
- Operational data (temperature, pressure, mass flow rate, density, etc.), often by stream references to a mass balance
- Process stream names
Process flow diagrams generally do not include:
- Pipe classes or piping line numbers
- Instrumentation details
- Minor bypass lines
- Isolation and shutoff valves
- Maintenance vents and drains
- Relief and safety valves
- Flanges
Process flow diagrams of multiple process units within a large industrial plant usually contain less detail and may be called block flow diagrams or schematic flow diagrams.

02Process flow diagram examples
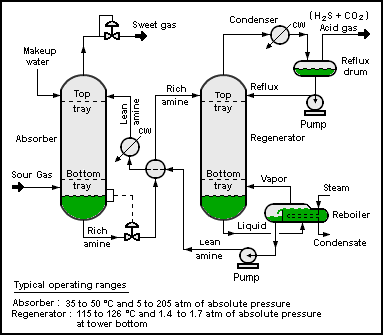
The process flow diagram below depicts a single chemical engineering unit process known as an amine treating plant:
Multiple process units within an industrial plant
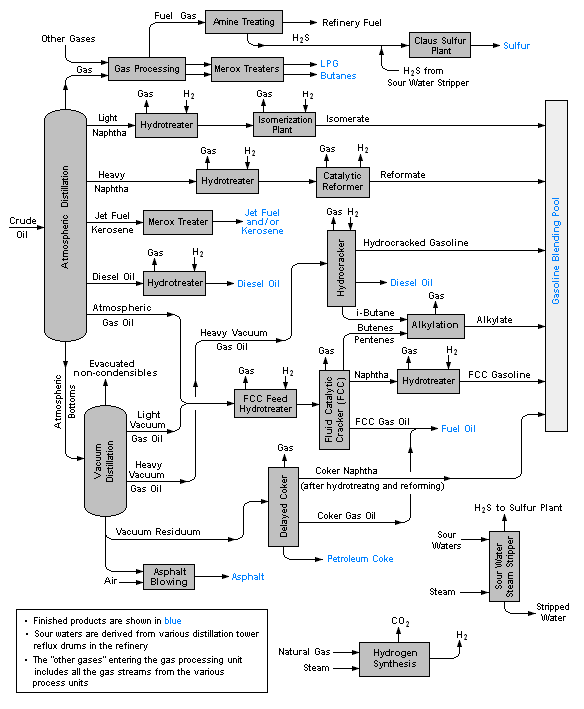
The process flow diagram below is an example of a schematic or block flow diagram and depicts the various unit processes within a typical oil refinery:
03Other items of interest
A PFD can be generated by process simulators (see List of Chemical Process Simulators), CAD packages, or flow chart software using a library of chemical engineering symbols. Rules and symbols are available from standardization organizations such as DIN, ISO or ANSI. Often PFDs are produced on large sheets of paper.
PFDs of many commercial processes can be found in the literature, specifically in encyclopedias of chemical technology, although some might be outdated. To find recent ones, patent databases such as those available from the United States Patent and Trademark Office can be useful.
04Standards
- ISO 15519-1:2010(en): Specification for diagrams for process industry, Part 1: General rules
- ISO 15519-2:2015(en): Specifications for diagrams for process industry, Part 2: Measurement and control
- ISO 10628-1:2014(en): Diagrams for the chemical and petrochemical industry, Part 1: Specification of diagrams
- ISO 10628-2:2012(en): Diagrams for the chemical and petrochemical industry, Part 2: Graphical symbols
- ANSI Y32.11: Graphical Symbols For Process Flow Diagrams (withdrawn 2003)
- SAA AS 1109: Graphical Symbols For Process Flow Diagrams For The Food Industry
Sources and credits
This article is adapted from the Wikipedia article “Process flow diagram”, written by its contributors and licensed under CC BY-SA 4.0. Fathomly has changed the layout, removed citation markers, navigation and maintenance notices, and adjusted punctuation. This adapted version is shared under the same license. For references, see the original article.
Images, from Wikimedia Commons:
- Pfd-symbols.png by en:User:Jdpipe, GPL
- AmineTreating.png by No machine-readable author provided. Mbeychok assumed (based on copyright claims)., CC BY-SA 3.0
- RefineryFlow.png by Unknown author, CC BY-SA 3.0
Fathomly is not affiliated with or endorsed by the Wikimedia Foundation. Spotted a problem? Tell us.