Multinomial test
Multinomial test is the statistical test of the null hypothesis that the parameters of a multinomial distribution equal specified values; it is used for categorical data.
Beginning with a sample of 


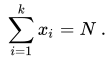
Next, defining a vector of parameters 

The exact probability of the observed configuration 
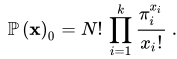
The significance probability for the test is the probability of occurrence of the data set observed, or of a data set less likely than that observed, if the null hypothesis is true. Using an exact test, this is calculated as
![~p_{\mathcal {[sig]}}=\sum _{\mathbf {y} \,:\;\operatorname {\mathbb {P} } \left(\mathbf {y} \right)\,\leq \,\operatorname {\mathbb {P} } \left(\mathbf {x} \right)_{0}}\operatorname {\mathbb {P} } \left(\mathbf {y} \right)~](https://wikimedia.org/api/rest_v1/media/math/render/svg/2c18963777682e7b06e0be1cb7335d89ec3352a5)
where the sum ranges over all outcomes as likely as, or less likely than, that observed. In practice this becomes computationally onerous as 
One of these approximations is the likelihood ratio. An alternative hypothesis can be defined under which each value 

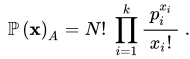
The natural logarithm of the likelihood ratio, ![~[{\mathcal {LR}}]~,](https://wikimedia.org/api/rest_v1/media/math/render/svg/883f5de95591070f3a0077044d53b0e067e7fc46)

![~-2\ln([{\mathcal {LR}}])=-2\;\sum _{i=1}^{k}x_{i}\ln \left({\frac {\pi _{i}}{p_{i}}}\right)~.](https://wikimedia.org/api/rest_v1/media/math/render/svg/d7864245e0d1d0377be2f539faaf573a5cfc8426)
(The factor 
If the null hypothesis is true, then as ![~-2\ln([{\mathcal {LR}}])~](https://wikimedia.org/api/rest_v1/media/math/render/svg/f56efcae14fb6be0df4228bcb2322e143b8294cd)


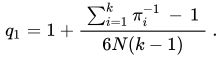
In the special case where the null hypothesis is that all the values 

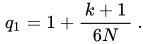
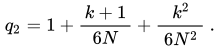
Subsequently, Smith et al. derived a dividing factor which matches the first moment as far as 

The null hypothesis can also be tested by using Pearson's chi-squared test
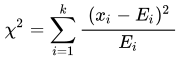
where 

Sources and credits
This article is adapted from the Wikipedia article “Multinomial test”, written by its contributors and licensed under CC BY-SA 4.0. Fathomly has changed the layout, removed citation markers, navigation and maintenance notices, and adjusted punctuation. This adapted version is shared under the same license. For references, see the original article.
Fathomly is not affiliated with or endorsed by the Wikimedia Foundation. Spotted a problem? Tell us.