Semi-log plot
Type of graph

In science and engineering, a semi-log plot/graph or semi-logarithmic plot/graph has one axis on a logarithmic scale, the other on a linear scale. It is useful for data with exponential relationships, where one variable covers a large range of values.
All equations of the form 

This is a line with slope 


A log-linear (sometimes log-lin) plot has the logarithmic scale on the y-axis, and a linear scale on the x-axis; a linear-log (sometimes lin-log) is the opposite. The naming is output-input (y, x), the opposite order from (x, y).
On a semi-log plot the spacing of the scale on the y-axis (or x-axis) is proportional to the logarithm of the number, not the number itself. It is equivalent to converting the y values (or x values) to their log, and plotting the data on linear scales. A log-log plot uses the logarithmic scale for both axes, and hence is not a semi-log plot.
01Equations
The equation of a line on a linear-log plot, where the abscissa axis is scaled logarithmically (with a logarithmic base of n), would be

The equation for a line on a log-linear plot, with an ordinate axis logarithmically scaled (with a logarithmic base of n), would be:


Finding the function from the semi-log plot
Linear-log plot
On a linear-log plot, pick some fixed point (x0, F0), where F0 is shorthand for F(x0), somewhere on the straight line in the above graph, and further some other arbitrary point (x1, F1) on the same graph. The slope formula of the plot is:
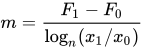
which leads to

or

which means that

In other words, F is proportional to the logarithm of x times the slope of the straight line of its lin-log graph, plus a constant. Specifically, a straight line on a lin-log plot containing points (F0, x0) and (F1, x1) will have the function:
![F(x)=(F_{1}-F_{0}){\left[{\frac {\log _{n}(x/x_{0})}{\log _{n}(x_{1}/x_{0})}}\right]}+F_{0}=(F_{1}-F_{0})\log _{\frac {x_{1}}{x_{0}}}{\left({\frac {x}{x_{0}}}\right)}+F_{0}](https://wikimedia.org/api/rest_v1/media/math/render/svg/da143562dac9e25d0e2a741861ef66bb7077d6f6)
log-linear plot
On a log-linear plot (logarithmic scale on the y-axis), pick some fixed point (x0, F0), where F0 is shorthand for F(x0), somewhere on the straight line in the above graph, and further some other arbitrary point (x1, F1) on the same graph. The slope formula of the plot is:
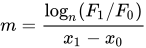
which leads to

Notice that nlogn(F1) = F1. Therefore, the logs can be inverted to find:
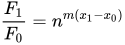
or

This can be generalized for any point, instead of just F1:


02Real-world examples
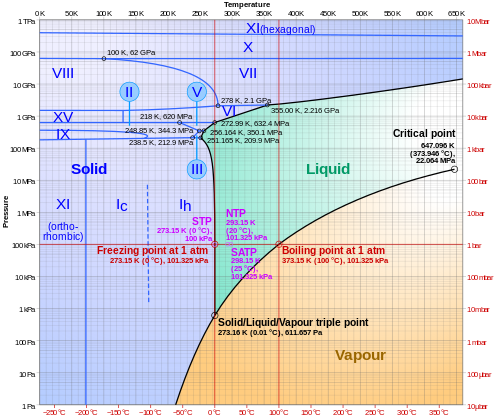
Phase diagram of water
In physics and chemistry, a plot of logarithm of pressure against temperature can be used to illustrate the various phases of a substance, as in the following for water:
2009 "swine flu" progression
While ten is the most common base, there are times when other bases are more appropriate, as in this example:
Notice that while the horizontal (time) axis is linear, with the dates evenly spaced, the vertical (cases) axis is logarithmic, with the evenly spaced divisions being labelled with successive powers of two. The semi-log plot makes it easier to see when the infection has stopped spreading at its maximum rate, i.e. the straight line on this exponential plot, and starts to curve to indicate a slower rate. This might indicate that some form of mitigation action is working, e.g. social distancing.
Microbial growth
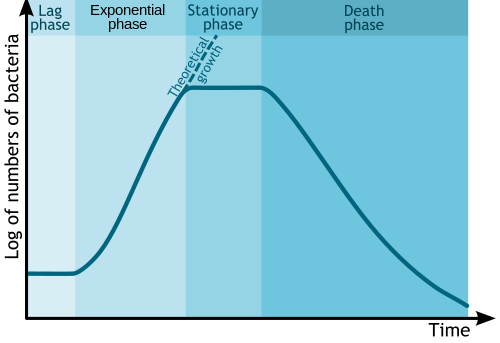
In biology and biological engineering, the change in numbers of microbes due to asexual reproduction and nutrient exhaustion is commonly illustrated by a semi-log plot. Time is usually the independent axis, with the logarithm of the number or mass of bacteria or other microbe as the dependent variable. This forms a plot with four distinct phases, as shown below.

Sources and credits
This article is adapted from the Wikipedia article “Semi-log plot”, written by its contributors and licensed under CC BY-SA 4.0. Fathomly has changed the layout, removed citation markers, navigation and maintenance notices, and adjusted punctuation. This adapted version is shared under the same license. For references, see the original article.
Images, from Wikimedia Commons:
- LogLinScale.svg by Original: davidfg Vector: Autopilot, CC BY-SA 3.0
- LinLogScale.svg by Autopilot, CC BY-SA 3.0
- Phase diagram of water.svg by Cmglee, CC BY-SA 3.0
- Influenza-2009-cases-logarithmic.png by Grochim Later updates by Spaully, CC BY-SA 3.0
- Bacterial growth en.svg by M•Komorniczak -talk- Illustration by : Michał Komorniczak This file has been released into the Creative Commons 3.0. Attribution-ShareAlike (CC BY-SA 3.0) If you use on your website or in your publication my images (either original or modified), you are requested to give me details: Michał Komorniczak (Poland) or Michal Komorniczak (Poland). For more information, write to my e-mail address: m.komorniczak.pl@gmail.com, CC BY-SA 3.0
Fathomly is not affiliated with or endorsed by the Wikimedia Foundation. Spotted a problem? Tell us.


