Function model
Representation on functions in computer engineering

In systems engineering, software engineering, and computer science, a function model or functional model is a structured representation of the functions (activities, actions, processes, operations) within the modeled system or subject area.
A function model, similar to the activity model or process model, is a graphical representation of an enterprise's function within a defined scope. The purposes of the function model are to describe the functions and processes, assist with discovery of information needs, help identify opportunities, and establish a basis for determining product and service costs.
01History
The function model in the field of systems engineering and software engineering originates in the 1950s and 1960s, but the origin of functional modelling of organizational activity goes back to the late 19th century.
In the late 19th century the first diagrams appeared that pictured business activities, actions, processes, or operations, and in the first half of the 20th century the first structured methods for documenting business process activities emerged. One of those methods was the flow process chart, introduced by Frank Gilbreth to members of American Society of Mechanical Engineers (ASME) in 1921 with the presentation, entitled “Process Charts, First Steps in Finding the One Best Way”. Gilbreth's tools quickly found their way into industrial engineering curricula.
The emergence of the field of systems engineering can be traced back to Bell Telephone Laboratories in the 1940s. The need to identify and manipulate the properties of a system as a whole, which in complex engineering projects may greatly differ from the sum of the parts' properties, motivated various industries to apply the discipline. One of the first to define the function model in this field was the British engineer William Gosling. In his book The design of engineering systems (1962, p. 25) he stated:
- A functional model must thus achieve two aims in order to be of use. It must furnish a throughput description mechanics capable of completely defining the first and last throughput states, and perhaps some of the intervening states. It must also offer some means by which any input, correctly described in terms of this mechanics, can be used to generate an output which is an equally correct description of the output which the actual system would have given for the input concerned. It may also be noted that there are two other things which a functional model may do, but which are not necessary to all functional models. Thus such a system may, but need not, describe the system throughputs other than at the input and output, and it may also contain a description of the operation which each element carries out on the throughput, but once again this is not.
One of the first well defined function models, was the functional flow block diagram (FFBD) developed by the defense-related TRW Incorporated in the 1950s. In the 1960s it was exploited by the NASA to visualize the time sequence of events in a space systems and flight missions. It is further widely used in classical systems engineering to show the order of execution of system functions.


02Functional modeling topics
Functional perspective
In systems engineering and software engineering a function model is created with a functional modeling perspective. The functional perspective is one of the perspectives possible in business process modelling, other perspectives are for example behavioural, organisational or informational.
A functional modeling perspective concentrates on describing the dynamic process. The main concept in this modeling perspective is the process, this could be a function, transformation, activity, action, task etc. A well-known example of a modeling language employing this perspective is data flow diagrams.
The perspective uses four symbols to describe a process, these being:
- Process: Illustrates transformation from input to output.
- Store: Data-collection or some sort of material.
- Flow: Movement of data or material in the process.
- External Entity: External to the modeled system, but interacts with it.
Now, with these symbols, a process can be represented as a network of these symbols. This decomposed process is a DFD, data flow diagram.
In Dynamic Enterprise Modeling a division is made in the Control model, Function Model, Process model and Organizational model.
Functional decomposition
Functional decomposition refers broadly to the process of resolving a functional relationship into its constituent parts in such a way that the original function can be reconstructed from those parts by function composition. In general, this process of decomposition is undertaken either for the purpose of gaining insight into the identity of the constituent components, or for the purpose of obtaining a compressed representation of the global function, a task which is feasible only when the constituent processes possess a certain level of modularity.
Functional decomposition has a prominent role in computer programming, where a major goal is to modularize processes to the greatest extent possible. For example, a library management system may be broken up into an inventory module, a patron information module, and a fee assessment module. In the early decades of computer programming, this was manifested as the "art of subroutining," as it was called by some prominent practitioners.
Functional decomposition of engineering systems is a method for analyzing engineered systems. The basic idea is to try to divide a system in such a way that each block of the block diagram can be described without an "and" or "or" in the description.
This exercise forces each part of the system to have a pure function. When a system is composed of pure functions, they can be reused, or replaced. A usual side effect is that the interfaces between blocks become simple and generic. Since the interfaces usually become simple, it is easier to replace a pure function with a related, similar function.

03Functional modeling methods
The functional approach is extended in multiple diagrammic techniques and modeling notations. This section gives an overview of the important techniques in chronological order.
Function block diagram
A functional block diagram is a block diagram, that describes the functions and interrelationships of a system. The functional block diagram can picture:
- Functions of a system pictured by blocks
- Input of a block pictured with lines, and
- Relationships between 9 functions
- Functional sequences and paths for matter and or signals
The block diagram can use additional schematic symbols to show particular properties.
Specific function block diagram are the classic functional flow block diagram, and the Function Block Diagram (FBD) used in the design of programmable logic controllers.
Functional flow block diagram
The functional flow block diagram (FFBD) is a multi-tier, time-sequenced, step-by-step flow diagram of the system's functional flow. The diagram is developed in the 1950s and widely used in classical systems engineering. The functional flow block diagram is also referred to as Functional Flow Diagram, functional block diagram, and functional flow.
Functional flow block diagrams (FFBD) usually define the detailed, step-by-step operational and support sequences for systems, but they are also used effectively to define processes in developing and producing systems. The software development processes also use FFBDs extensively. In the system context, the functional flow steps may include combinations of hardware, software, personnel, facilities, and/or procedures.
In the FFBD method, the functions are organized and depicted by their logical order of execution. Each function is shown with respect to its logical relationship to the execution and completion of other functions. A node labeled with the function name depicts each function. Arrows from left to right show the order of execution of the functions. Logic symbols represent sequential or parallel execution of functions.
HIPO and oPO
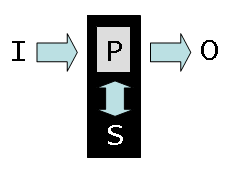
HIPO for hierarchical input process output is a popular 1970s systems analysis design aid and documentation technique for representing the modules of a system as a hierarchy and for documenting each module.
It was used to develop requirements, construct the design, and support implementation of an expert system to demonstrate automated rendezvous. Verification was then conducted systematically because of the method of design and implementation.
The overall design of the system is documented using HIPO charts or structure charts. The structure chart is similar in appearance to an organizational chart, but has been modified to show additional detail. Structure charts can be used to display several types of information, but are used most commonly to diagram either data structures or code structures.
N2 Chart
The N2 Chart is a diagram in the shape of a matrix, representing functional or physical interfaces between system elements. It is used to systematically identify, define, tabulate, design, and analyze functional and physical interfaces. It applies to system interfaces and hardware and/or software interfaces.
The N2 diagram has been used extensively to develop data interfaces, primarily in the software areas. However, it can also be used to develop hardware interfaces. The basic N2 chart is shown in Figure 2. The system functions are placed on the diagonal; the remainder of the squares in the N × N matrix represent the interface inputs and outputs.
Structured Analysis and Design Technique
Structured Analysis and Design Technique (SADT) is a software engineering methodology for describing systems as a hierarchy of functions, a diagrammatic notation for constructing a sketch for a software application. It offers building blocks to represent entities and activities, and a variety of arrows to relate boxes. These boxes and arrows have an associated informal semantics. SADT can be used as a functional analysis tool of a given process, using successive levels of details. The SADT method allows to define user needs for IT developments, which is used in industrial Information Systems, but also to explain and to present an activity's manufacturing processes, procedures.
The SADT supplies a specific functional view of any enterprise by describing the functions and their relationships in a company. These functions fulfill the objectives of a company, such as sales, order planning, product design, part manufacturing, and human resource management. The SADT can depict simple functional relationships and can reflect data and control flow relationships between different functions. The IDEF0 formalism is based on SADT, developed by Douglas T. Ross in 1985.
IDEF0
IDEF0 is a function modeling methodology for describing manufacturing functions, which offers a functional modeling language for the analysis, development, re-engineering, and integration of information systems; business processes; or software engineering analysis. It is part of the IDEF family of modeling languages in the field of software engineering, and is built on the functional modeling language building SADT.
The IDEF0 Functional Modeling method is designed to model the decisions, actions, and activities of an organization or system. It was derived from the established graphic modeling language structured analysis and design technique (SADT) developed by Douglas T. Ross and SofTech, Inc. In its original form, IDEF0 includes both a definition of a graphical modeling language (syntax and semantics) and a description of a comprehensive methodology for developing models. The US Air Force commissioned the SADT developers to develop a function model method for analyzing and communicating the functional perspective of a system. IDEF0 should assist in organizing system analysis and promote effective communication between the analyst and the customer through simplified graphical devices.
Axiomatic design
Axiomatic design is a top down hierarchical functional decomposition process used as a solution synthesis framework for the analysis, development, re-engineering, and integration of products, information systems, business processes or software engineering solutions. Its structure is suited mathematically to analyze coupling between functions in order to optimize the architectural robustness of potential functional solution models.

04Related types of models
In the field of systems and software engineering numerous specific function and functional models and close related models have been defined. Here only a few general types will be explained.
Business function model
A Business Function Model (BFM) is a general description or category of operations performed routinely to carry out an organization's mission. They "provide a conceptual structure for the identification of general business functions". It can show the critical business processes in the context of the business area functions. The processes in the business function model must be consistent with the processes in the value chain models. Processes are a group of related business activities performed to produce an end product or to provide a service. Unlike business functions that are performed on a continual basis, processes are characterized by the fact that they have a specific beginning and an end point marked by the delivery of a desired output. The figure on the right depicts the relationship between the business processes, business functions, and the business area's business reference model.
Business Process Model and Notation
Business Process Model and Notation (BPMN) is a graphical representation for specifying business processes in a workflow. BPMN was developed by Business Process Management Initiative (BPMI), and is currently maintained by the Object Management Group since the two organizations merged in 2005. The current version of BPMN is 2.0.
The Business Process Model and Notation (BPMN) specification provides a graphical notation for specifying business processes in a Business Process Diagram (BPD). The objective of BPMN is to support business process management for both technical users and business users by providing a notation that is intuitive to business users yet able to represent complex process semantics. The BPMN specification also provides a mapping between the graphics of the notation to the underlying constructs of execution languages, particularly BPEL4WS.
Business reference model
A Business reference model is a reference model, concentrating on the functional and organizational aspects of the core business of an enterprise, service organization or government agency. In enterprise engineering a business reference model is part of an Enterprise Architecture Framework or Architecture Framework, which defines how to organize the structure and views associated with an Enterprise Architecture.
A reference model in general is a model of something that embodies the basic goal or idea of something and can then be looked at as a reference for various purposes. A business reference model is a means to describe the business operations of an organization, independent of the organizational structure that perform them. Other types of business reference model can also depict the relationship between the business processes, business functions, and the business area's business reference model. These reference model can be constructed in layers, and offer a foundation for the analysis of service components, technology, data, and performance.
Operator function model
The Operator Function Model (OFM) is proposed as an alternative to traditional task analysis techniques used by human factors engineers. An operator function model attempts to represent in mathematical form how an operator might decompose a complex system into simpler parts and coordinate control actions and system configurations so that acceptable overall system performance is achieved. The model represents basic issues of knowledge representation, information flow, and decision making in complex systems. Miller (1985) suggests that the network structure can be thought of as a possible representation of an operator's internal model of the system plus a control structure which specifies how the model is used to solve the decision problems that comprise operator control functions.

Sources and credits
This article is adapted from the Wikipedia article “Function model”, written by its contributors and licensed under CC BY-SA 4.0. Fathomly has changed the layout, removed citation markers, navigation and maintenance notices, and adjusted punctuation. This adapted version is shared under the same license. For references, see the original article.
Images, from Wikimedia Commons:
- IDEF Diagram Example.jpg by Defense Acquisition University, Public domain
- Fo2ufg823rhf832hfdorfg.JPG by DFD guru, Public domain
- Functional block diagram of the attitude control and maneuvering electronics system.jpg by McDonnell, "Project Gemini Familiarization Charts,", Public domain
- Functional Flow Block Diagram Format.jpg by US gov, Public domain
- IPO-S Model.gif by Dante Xavier Bari based on the work of others., Public domain
- N2 chart definition.JPG by NASA, Public domain
- SADT.svg by UlrichAAB, Public domain
Fathomly is not affiliated with or endorsed by the Wikimedia Foundation. Spotted a problem? Tell us.

