Average true range
Market volatility indicator
Average true range (ATR) is a technical analysis volatility indicator originally developed by J. Welles Wilder, Jr. for commodities. The indicator does not provide an indication of price trend, simply the degree of price volatility. The average true range is an N-period smoothed moving average (SMMA) of the true range values. Wilder recommended a 14-period smoothing.
01Calculation
The range of a day's trading is simply 
![{\text{TR}}={\max[({\text{high}}-{\mbox{low}}),\operatorname {abs} ({\text{high}}-{\text{close}}_{\text{prev}}),\operatorname {abs} ({\text{low}}-{\text{close}}_{\text{prev}})]}\,](https://wikimedia.org/api/rest_v1/media/math/render/svg/8047031510bc4cfb0be895e2f1094a2d1d2c65ee)
The true range is the largest of the:
- Most recent period's high minus the most recent period's low
- Absolute value of the most recent period's high minus the previous close
- Absolute value of the most recent period's low minus the previous close
The first term represents the true range when the previous close (closeprev) is situated within the current period's high-low range. The second term yields the maximum value when closeprev is lower than the current low, while the third term applies when closeprev is higher than the current high.
The formula can be simplified to:

The ATR at the moment of time t is calculated using the following formula: (This is one form of an exponential moving average)

The first ATR value is calculated using the arithmetic mean formula:
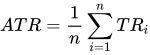
N.B. This first value is the first in the time series (not the most recent) and is n periods from the beginning of the chart.
The idea of ranges is that they show the commitment or enthusiasm of traders. Large or increasing ranges suggest traders prepared to continue to bid up or sell down a stock through the course of the day. Decreasing range suggests waning interest.

02Applicability to futures contracts vs. stocks
Since true range and ATR are calculated by subtracting prices, the volatility they compute does not change when historical prices are back-adjusted by adding or subtracting a constant to every price. Back-adjustments are often employed when splicing together individual monthly futures contracts to form a continuous futures contract spanning a long period of time. However the standard procedures used to compute volatility of stock prices, such as the standard deviation of logarithmic price ratios, are not invariant (to addition of a constant). Thus futures traders and analysts typically use one method (ATR) to calculate volatility, while stock traders and analysts typically use standard deviation of log price ratios.
03Use in position size calculation
Apart from being a trend strength gauge, ATR serves as an element of position sizing in financial trading. Current ATR value (or a multiple of it) can be used as the size of the potential adverse movement (stop-loss distance) when calculating the trade volume based on trader's risk tolerance. In this case, ATR provides a self-adjusting risk limit dependent on the market volatility for strategies without a fixed stop-loss placement.
Sources and credits
This article is adapted from the Wikipedia article “Average true range”, written by its contributors and licensed under CC BY-SA 4.0. Fathomly has changed the layout, removed citation markers, navigation and maintenance notices, and adjusted punctuation. This adapted version is shared under the same license. For references, see the original article.
Images, from Wikimedia Commons:
- ATR Indicator Chart.png by MetaQuotes, Copyrighted free use
Fathomly is not affiliated with or endorsed by the Wikimedia Foundation. Spotted a problem? Tell us.